Accuracy on Stationary Data Streams
We measure the statistical distance between the underlying distribution of various stationary data streams and the distributions estimated by using Sketch and its alternatives, oKDE and SPDTw. Three distributions of data streams are used. The first is a normal distribution, which appears frequently. The second is a bimodal distribution, which is used in order to test if the density estimation algorithms can recognize various modes. The third is a log-normal distribution, which is used in order to test if it can estimate a long tail. For all experiments, one thousand data are used, and the arithmetic mean of the statistical distance is calculated excluding the first three hundreds results in order to evaluate only in a stable phase. The parameters of Sketch are selected to have a similar statistical distance as oKDE and SPDTw.
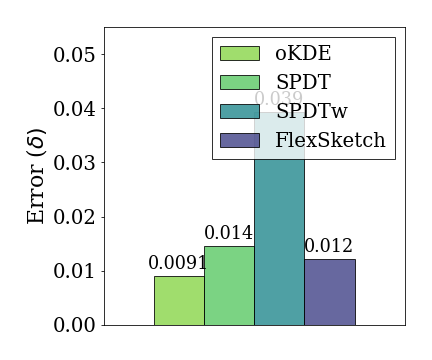
Normal Distribution
In the experiment for normal distribution, we use $\mathcal{N}(0, 1)$ as the underlying distribution of the data stream. The statistical distance of Sketch for a normal distribution is 0.012, which is 0.75$\times$, 1.2$\times$ and 3.2$\times$ less than that of oKDE, SPDT, and SPDTw, respectively.
It is intuitive that oKDE records the lowest statistical
distance. This is because oKDE estimates the distribution
by using a mixture of Gaussian distributions. SPDTw is
less accurate than Sketch since the number of data
updated by SPDTw is limited to a fixed size due to its
window.
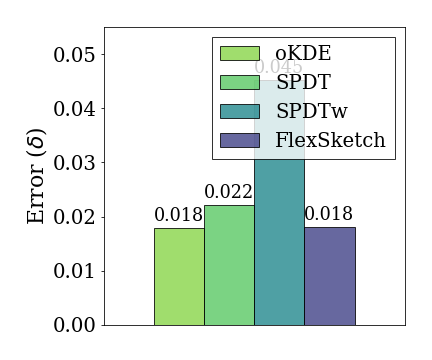
Bimodal Distribution
In the experiment for bimodal distribution, we use ${1}/{2} \cdot \mathcal{N}(-2, 1) + {1}/{2} \cdot \mathcal{N}(2, 1)$ as the underlying distribution of the data stream. The statistical distance of Sketch for a bimodal distribution is 0.018, which is 0.98$\times$, 1.2$\times$ and 2.5$\times$ less than that of
oKDE, SPDT and SPDTw, respectively.
The results for bimodal distribution show that it is intuitive that oKDE, which uses a Gaussian kernel, has the best result, as in the case of normal distribution. However, it is observed that the result of Sketch is similar to that of oKDE within the margin of error. This indicates that the majorUpdate algorithm builds a new model that recognizes various modes well. SPDTw is less accurate than Sketch for the same reason mentioned above.
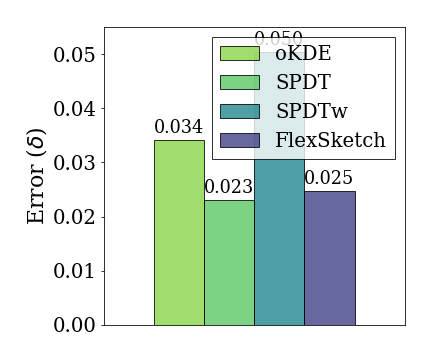
Log-normal Distribution
In the experiment for log-normal distribution, we use $\ln \mathcal{N}(0, 1)$ as the underlying distribution of the data stream. The statistical distance of Sketch for a log-normal distribution is 0.025, which is 1.4$\times$, 0.93$\times$ and 2.0$\times$ less than that of oKDE, SPDT, and SPDTw respectively.
Contrary to the result for normal and bimodal distributions, this result shows that Sketch and SPDT, which have a high degree of freedom, have lower statistical distance than oKDE, which uses a Gaussian kernel. SPDTw is less accurate than Sketch for the same reason mentioned above.