Benchmark
Throughput
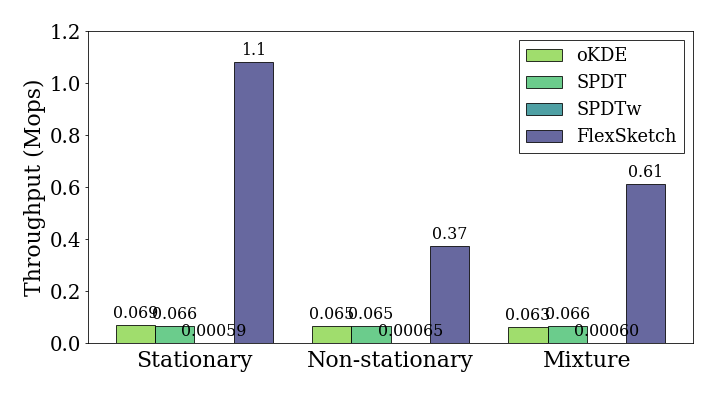
We conduct experiments on the throughput of the update and
probability operations, which are the key operations of
the density estimation algorithm. The results show that the throughput
has been improved significantly for both stationary and non-stationary
data streams, compared with the alternatives.
update
[fig:throughput-update]{reference-type=”ref”
reference=”fig:throughput-update”} plots the throughputs of the
update operation of different density estimation
algorithms, and the throughputs of each algorithm are measured for both
stationary and non-stationary normal distribution data streams. The
throughput of Sketch is 1.1 Mops/sec, which is
16$\times$, 16$\times$ and 1800$\times$ more than that of
[oKDE]{.sans-serif}, [SPDT]{.sans-serif}, and [SPDTw]{.sans-serif},
respectively, when performing the update operation for a
stationary data stream. For a non-stationary data stream, the throughput
of Sketch is 0.37 Mops/sec, which is 5.8$\times$,
5.7$\times$ and 570$\times$ more than that of [oKDE]{.sans-serif},
[SPDT]{.sans-serif}, and [SPDTw]{.sans-serif}, respectively.
This result demonstrates that the performance of the density estimation
of Sketch is most significantly improved when major
concept drift rarely occurs. Moreover, it shows a noticeable improvement
even for a data stream with frequent concept drift.
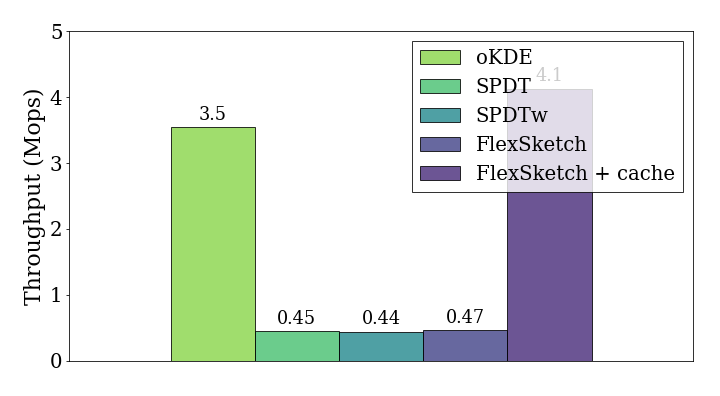
probability
[fig:throughput-probability]{reference-type=”ref”
reference=”fig:throughput-probability”} is the measurement of
throughputs after performing three hundreds update
operations of normal distribution for different density estimation
algorithms. The throughput of Sketch is 0.47 Mops/sec,
which is 0.13$\times$, 1.0$\times$ and 1.1$\times$ more than that of
[oKDE]{.sans-serif}, [SPDT]{.sans-serif}, and [SPDTw]{.sans-serif},
respectively. In order to improve the querying speed, we cache the
result. The throughput of Sketch with cache is 4.1
Mops/sec, which is 1.2$\times$, 9.2$\times$ and 9.4$\times$ more than
that of [oKDE]{.sans-serif}, [SPDT]{.sans-serif}, and
[SPDTw]{.sans-serif}, respectively.
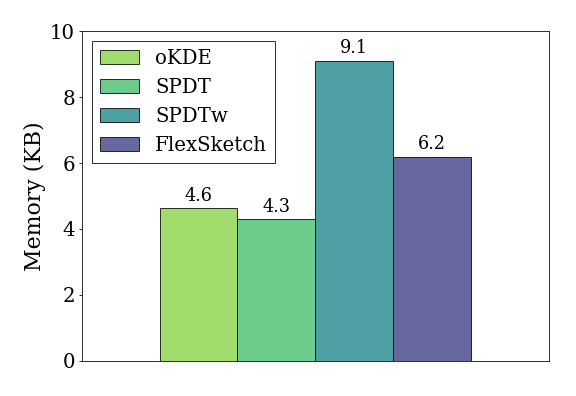
Memory Usage
\vspace{-3pt}
[fig:memory]{reference-type=”ref”
reference=”fig:memory”} demonstrates the amount of memory used in the
data structures of different density estimation algorithms when the
update operation is performed for one thousand data of the
data stream of normal distribution $\mathcal{N}(0, 1)$. Our experimental
result demonstrates that Sketch consumes 6.2 KB of
memory, which is 1.3$\times$, 1.4$\times$ and 0.68$\times$ more than
that of [oKDE]{.sans-serif}, [SPDT]{.sans-serif}, and
[SPDTw]{.sans-serif}, respectively.
The parameters of Sketch are selected so as to have
similar accuracy to the alternatives when it estimates for a stationary
data stream. The result indicates that it requires more memory to
achieve the same accuracy as [oKDE]{.sans-serif} and
[SPDT]{.sans-serif}. However, Sketch requires less than
3$\times$ of the memory usage of [SPDT]{.sans-serif} although it
ensembles three histograms. As mentioned in
3{reference-type=”ref” reference=”sec:error”}, the
Sketch framework manages to correct errors of each
model successfully, making it acceptable for individual models to have
higher errors.